Flux-o
A complete personal finance tracker, without distractions or paid features.
Project's scope
Design & development
Platform
Mobile & Desktop
Team
Solo contributor
Duration
4 weeks
The Opportunity
The initial spark for Flux-o came from a personal frustration with the current landscape of financial trackers, the tools we use to manage it are often overly complex, or frustrating.
Paywalls & Feature Limit
Essential features are often hidden behind subscription paywalls, or limit of use per specific period.
Rigid Mental Models
Almost all finance tools force users into a strict calendar-month structure
(1st to 30th/31st).
Excessive Friction
Most apps require multiple clicks, multiple screens just to perform a simple task, which discourages long-term habits.
The Vision
Flux-o was designed to eliminate these barriers, a tool that would reduce logging friction while presenting financial data in a elegant interface.
Instant Financial Pulse
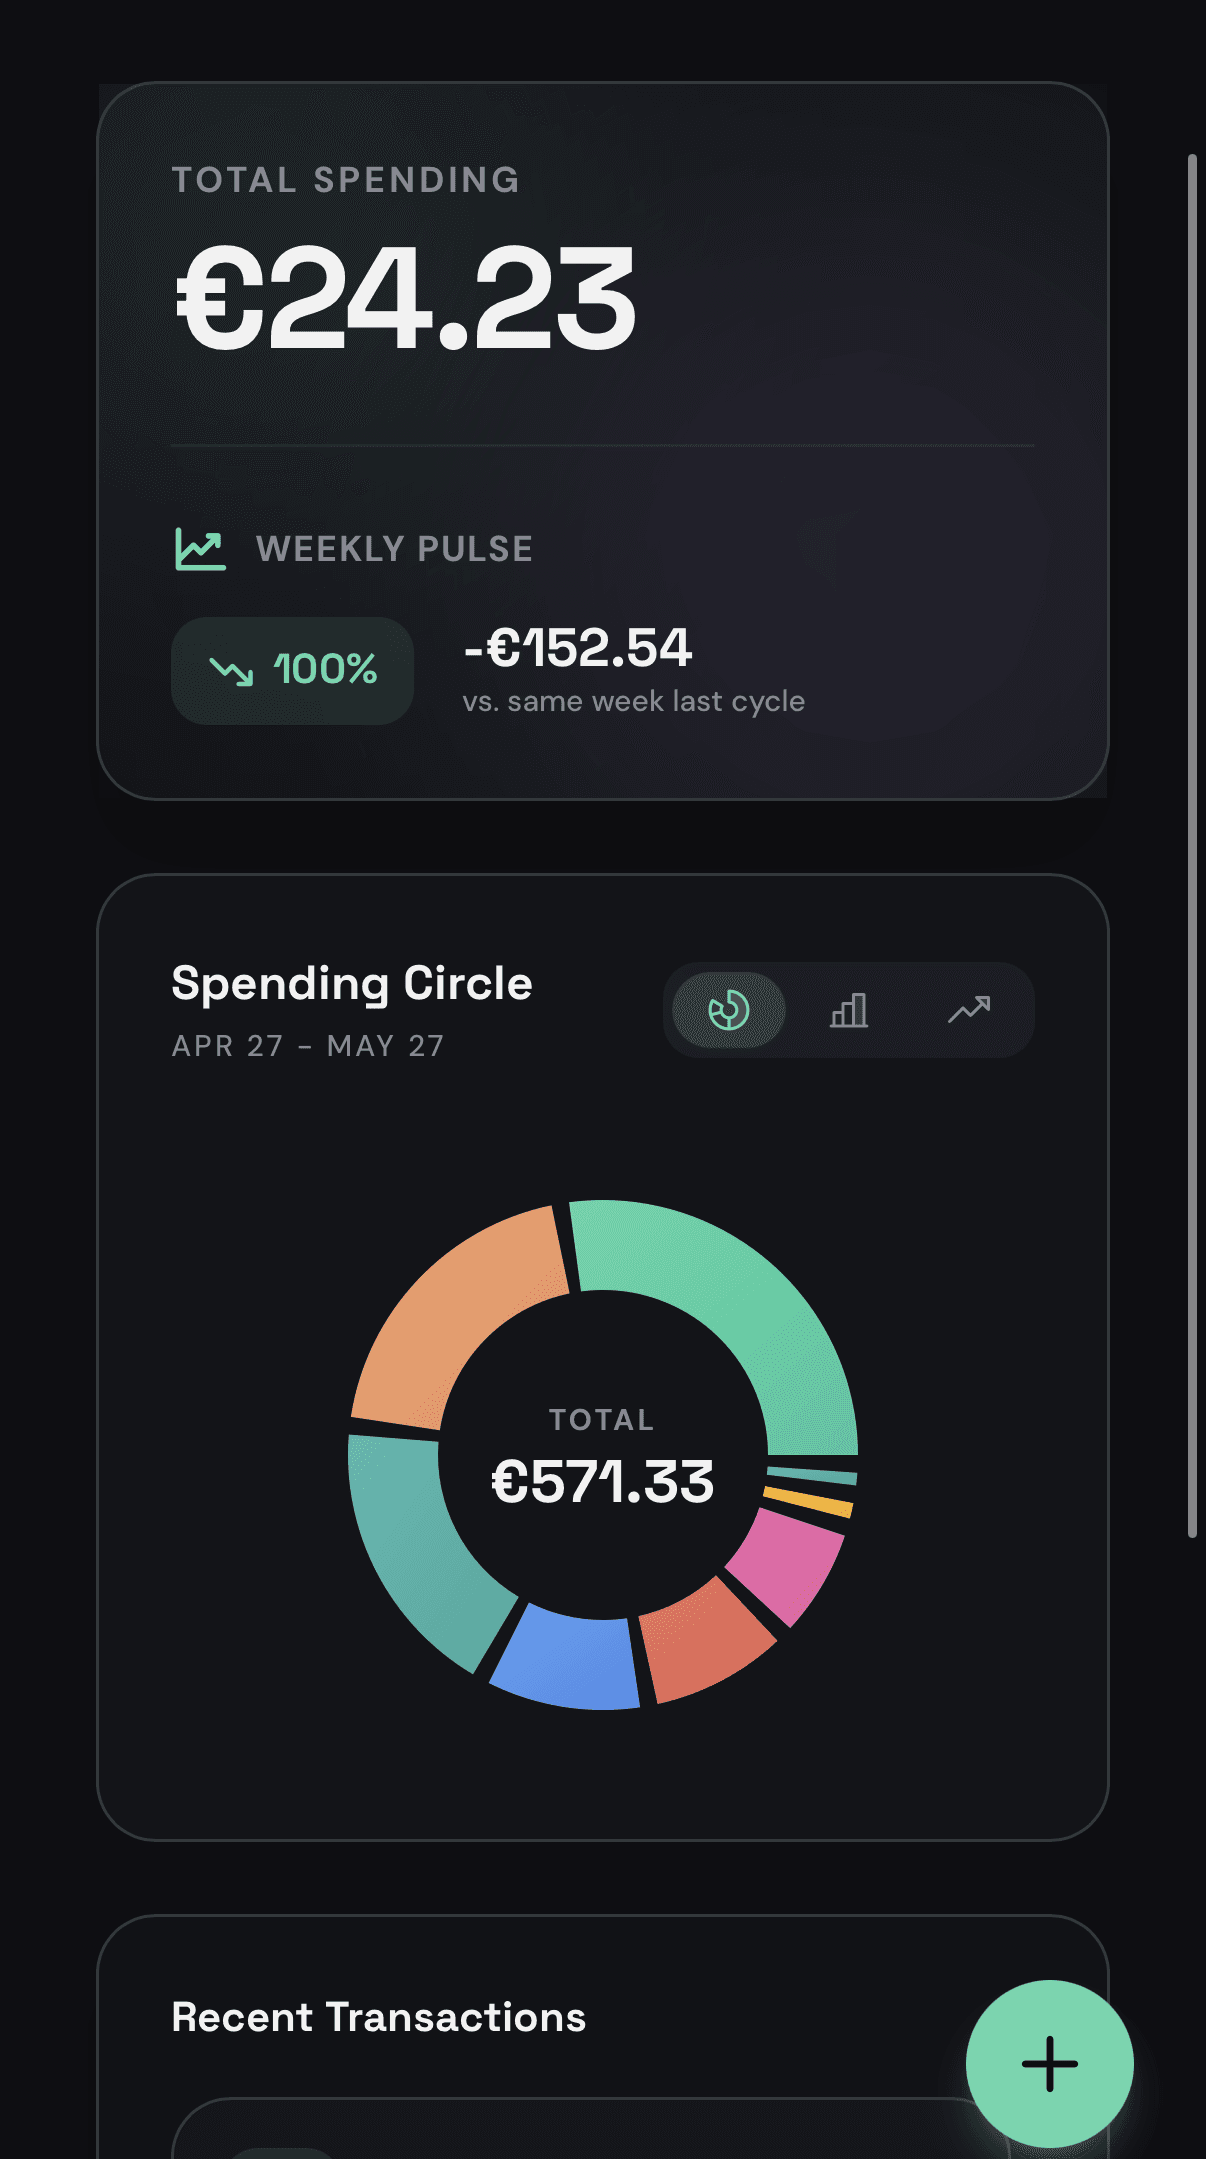
A simple, high-density homepage showcasing the active spending total and recent activity.
Low-Friction Input
A single, unified sheet that slides from the bottom to log expenses in seconds.
Premium, Emotive Aesthetics
Vibrant gradients to transform expense tracking into an interactive, satisfying ritual.
Target Audience
Individuals who want immediate frictionless financial transparency without annoying paywalls.
MVP Scope
Responsive Design
Mobile
Desktop
The layout expands dynamically. The floating bottom bar morphs into a left-side navigation sidebar, and the central charts sit side-by-side with recent transactions, taking full advantage of the horizontal workspace.
Tech stack details
The Results
Adaptive Dashboard
Displays active salary cycle metrics, the Weekly Pulse indicator, and an interactive Recharts area chart with custom gradients.
Full Custom Categories
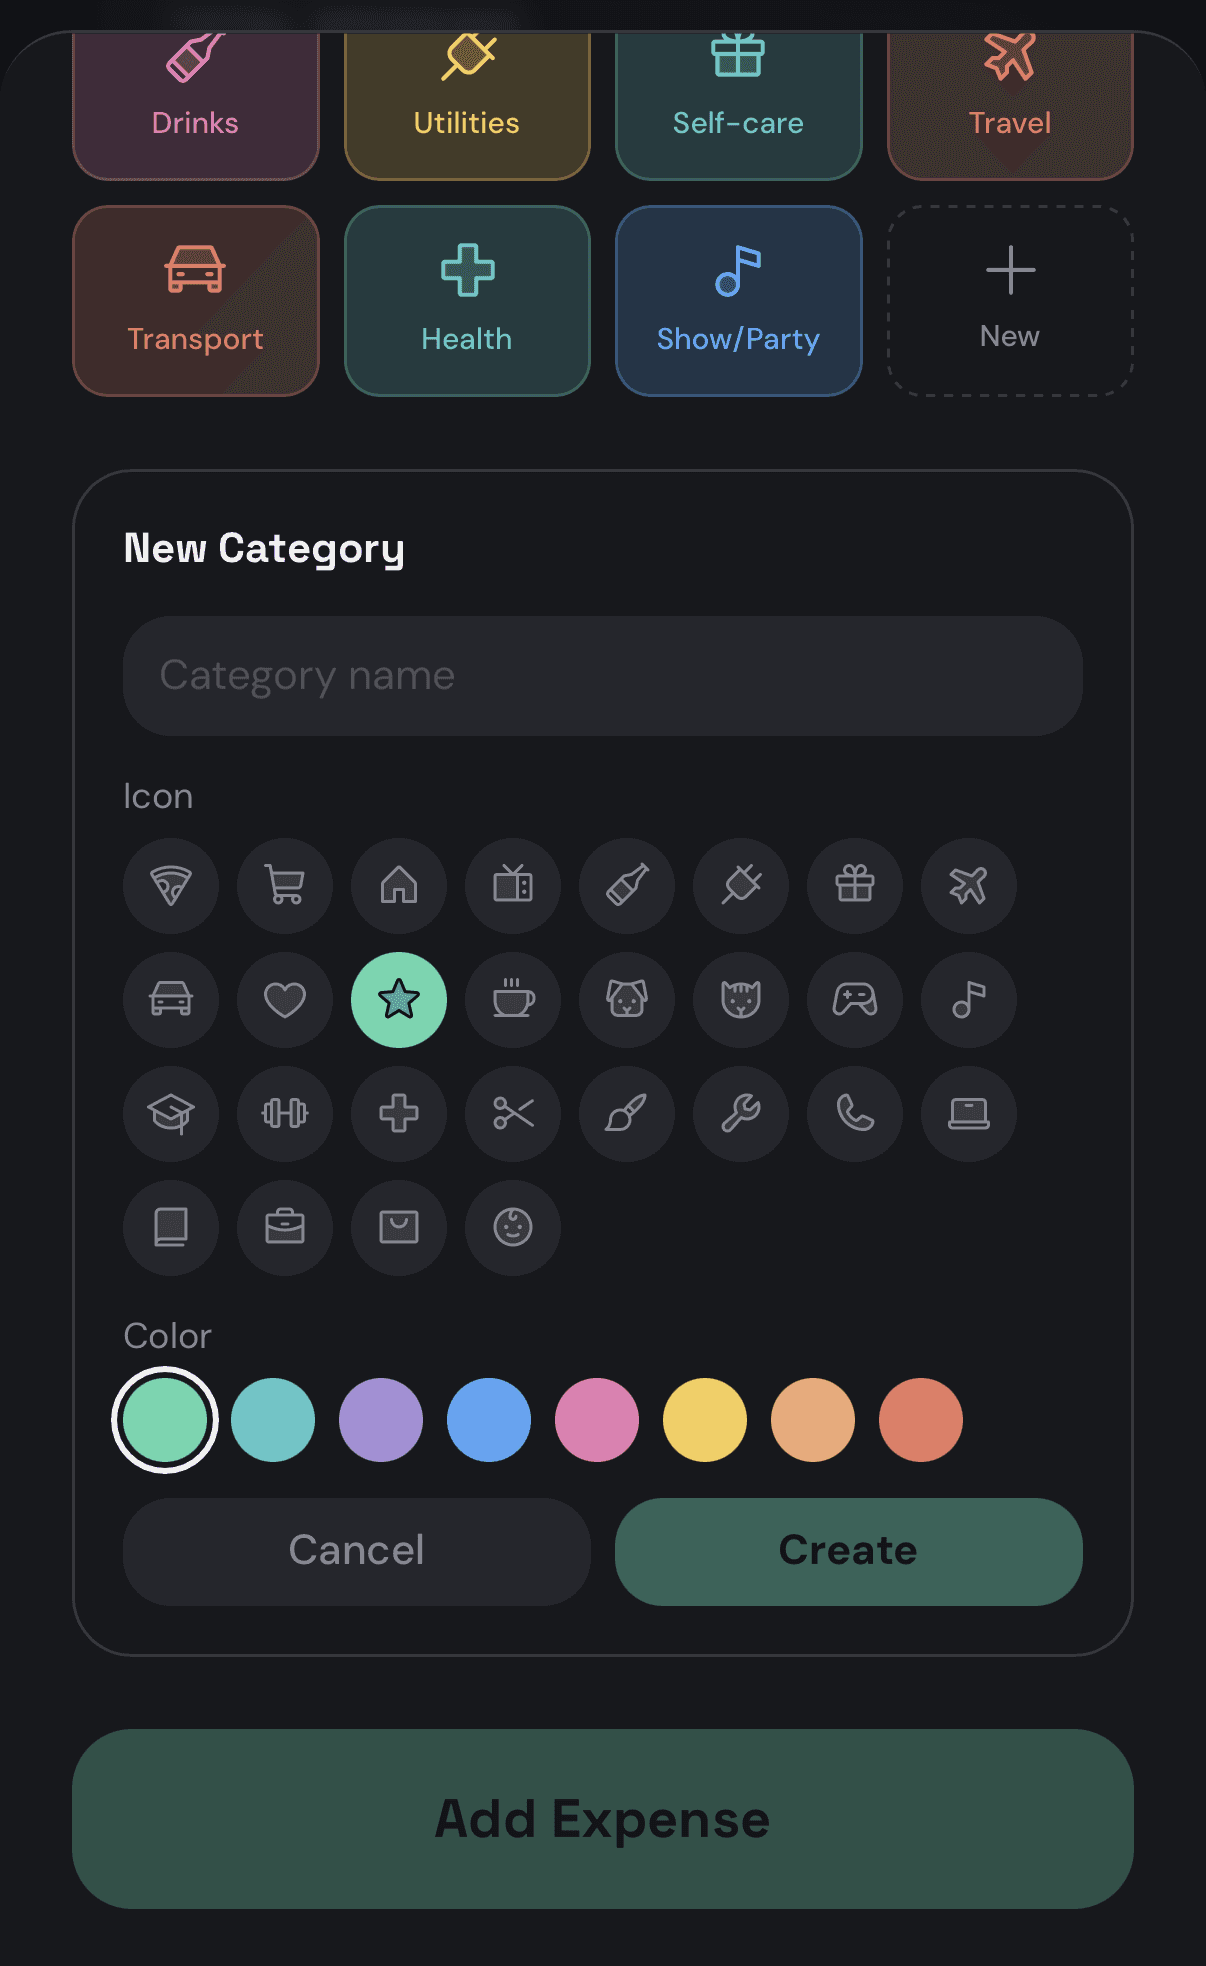
Users can expand their taxonomy with custom category tags, selecting from high-quality Phosphor icons and curated colors.
Granular Spend Analysis

Flexible Settings
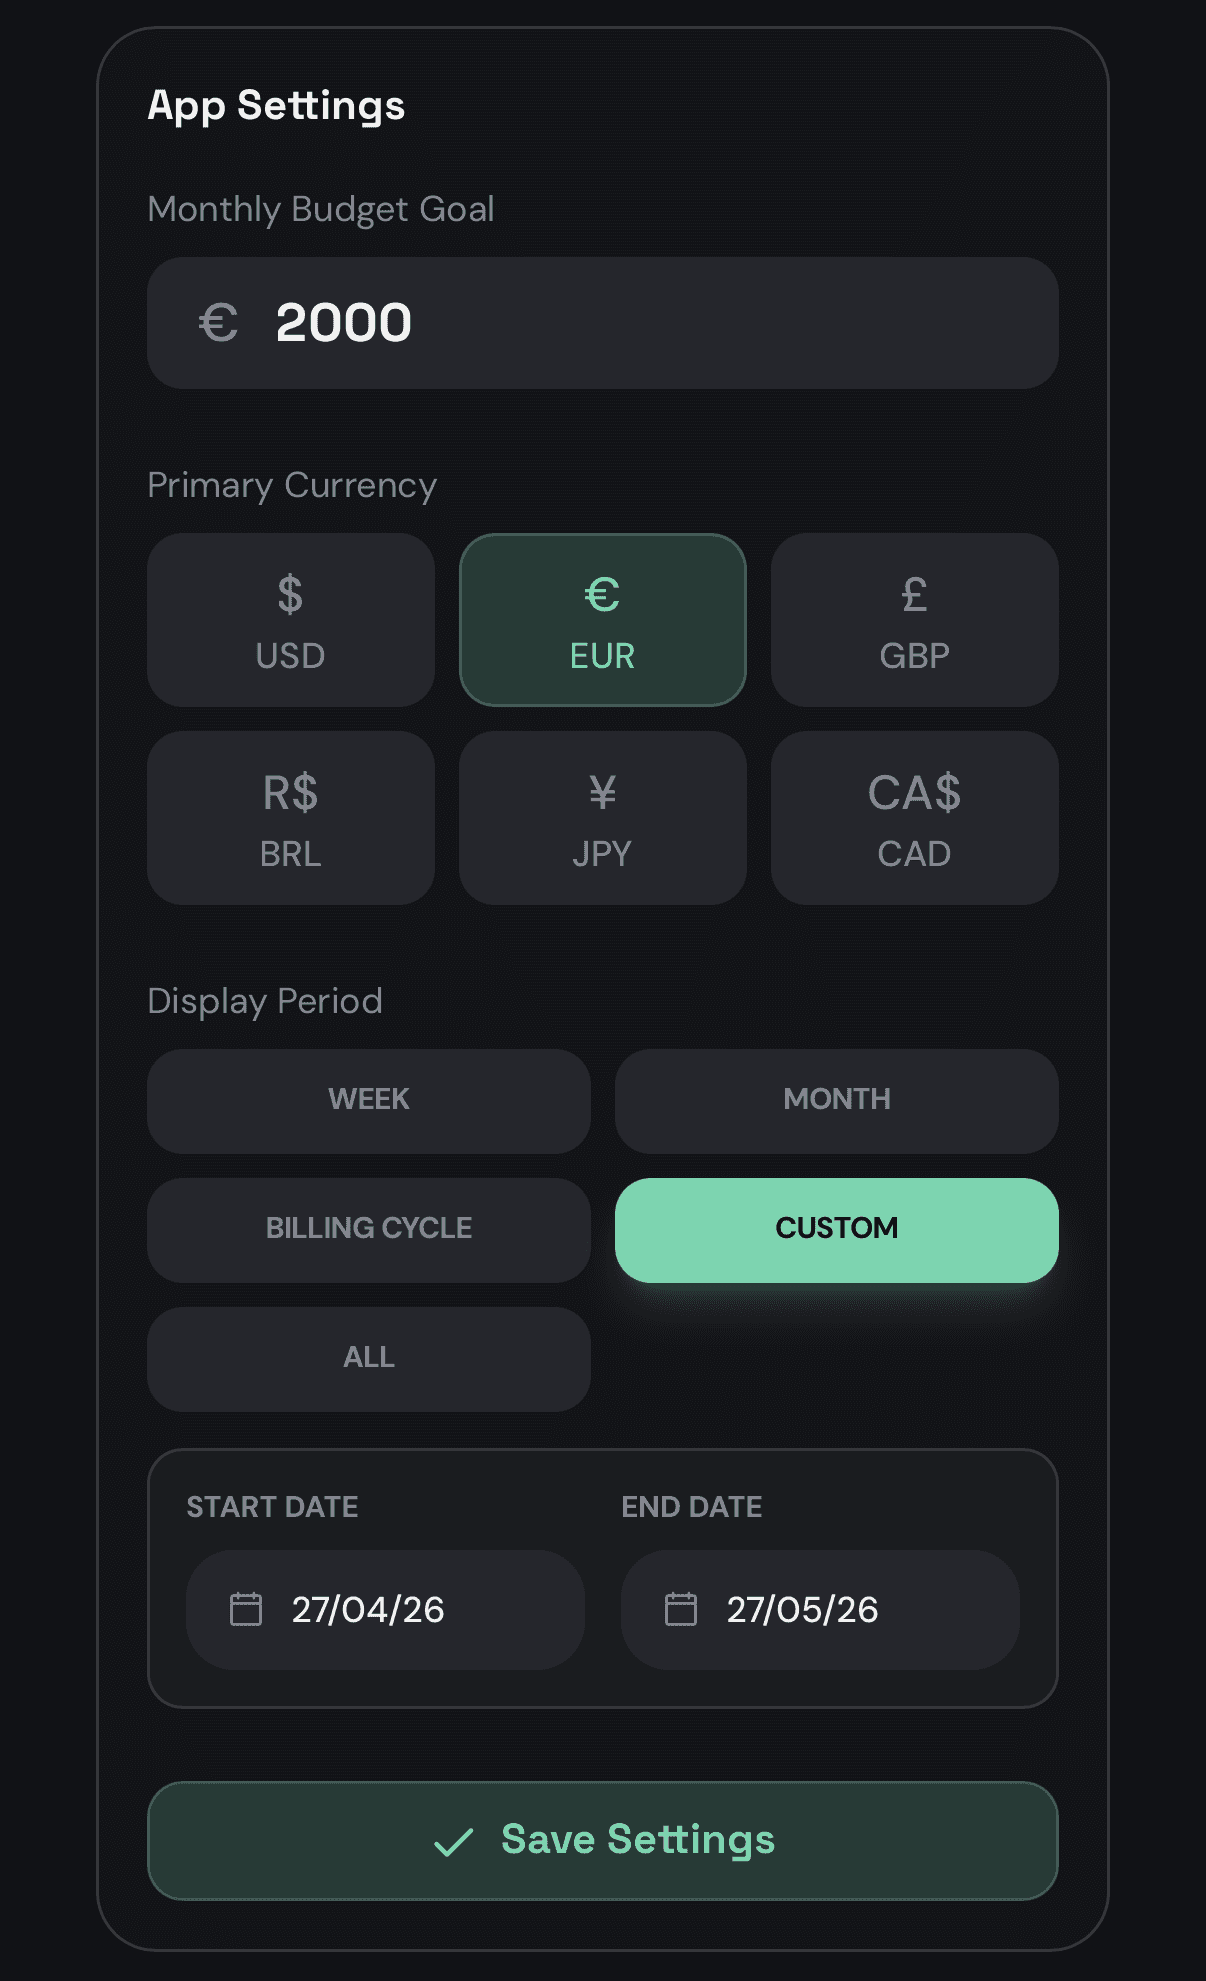
Allows users to adjust budget goals, switch primary currencies, toggle over-budget notifications, and override active periods (including custom date range selectors).